Drawing Maps with OSM Data and R
Sketching maps
I’ve said it before: there is a huge amount of data in OpenStreetMap. Some of it is available in a processed format at https://osmdata.openstreetmap.de/ (coastlines, land- and water-body outlines).
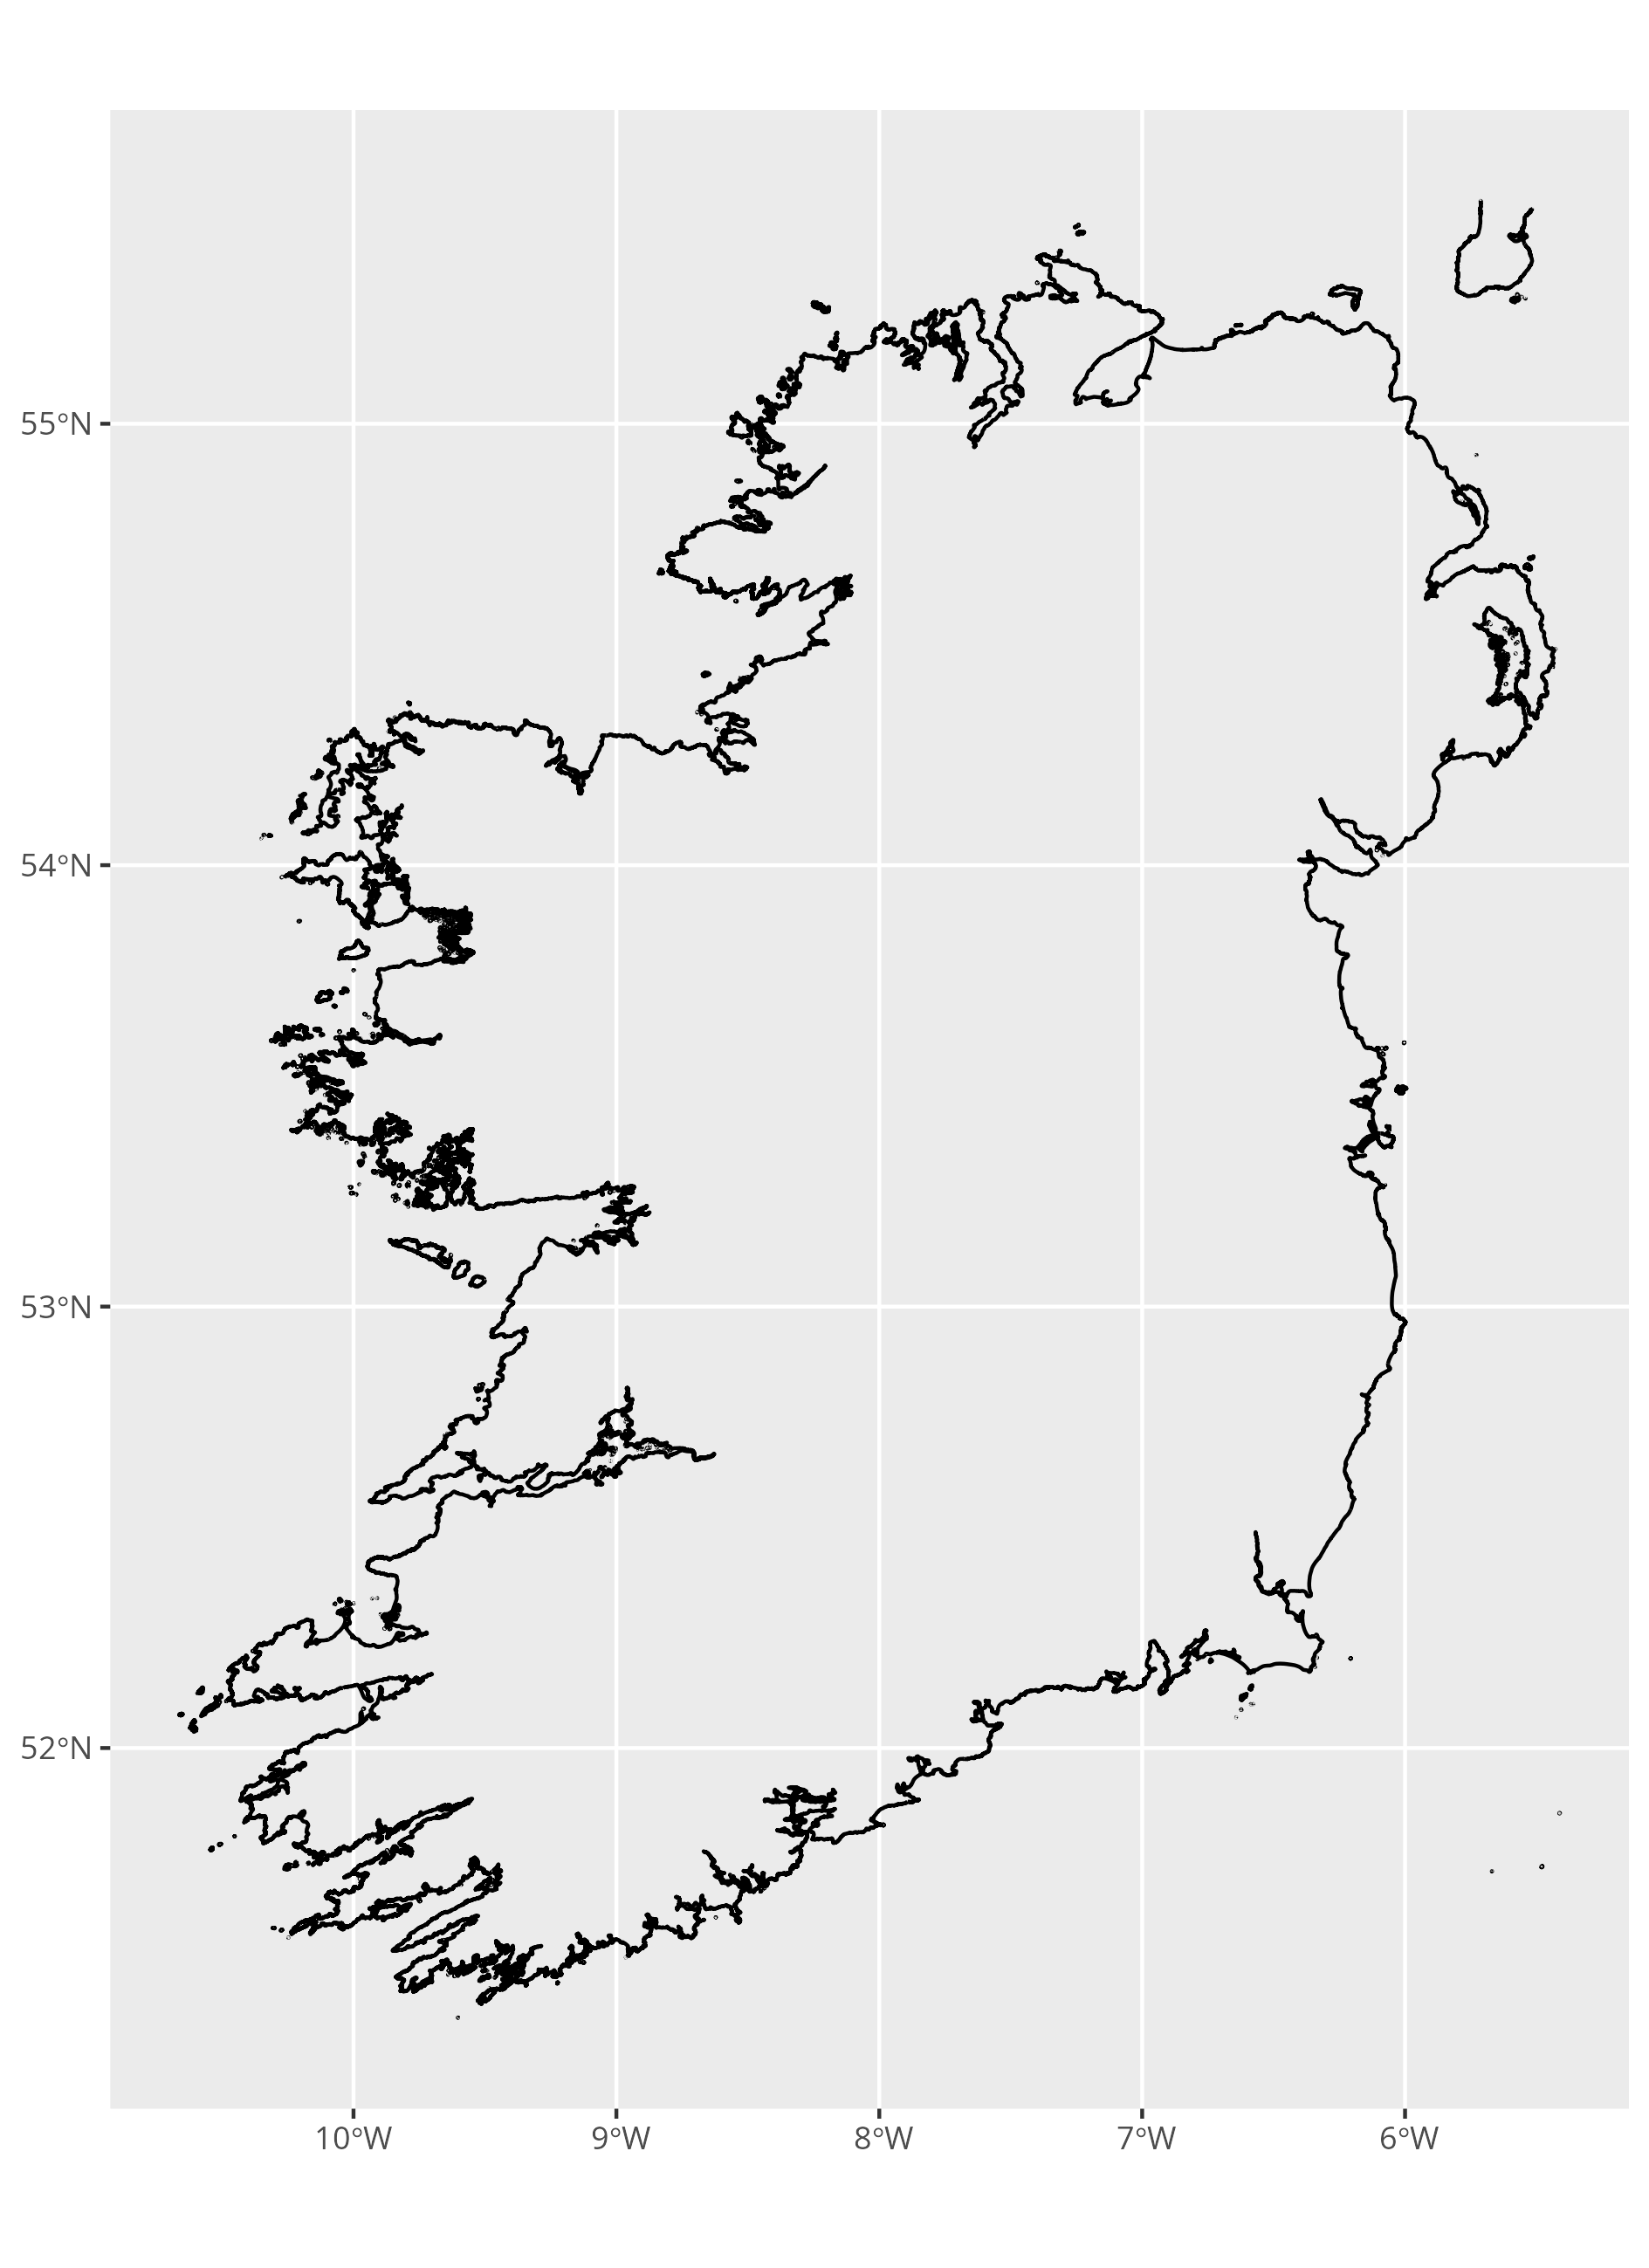
I decided to try to use it to draw Ireland, using coastline data. This is available in ESRI shapefile format at https://osmdata.openstreetmap.de/data/coastlines.html
There are lots of ways of processing this data. I’ve previously used Stata and Julia, but I decided to explore R’s capacity. The sf library covers lots of GIS functionality, and can read shapefiles:
library(sf)
coasts <- read_sf("coastlines-split-4326/lines.shp")
The data consist simply of feature-IDs and geometries. I can’t see any other labelling, and there is thus no convenient way to extract Irish data that I can see.
Improvising
I had to improvise: There is a st_bbox() function in sf, which extracts the bounding box for a geometry. I cooked up a little function to test for overlap between two bounding boxes:
## Test if two BBs overlap
bbolap <- function(A, B) {
  ((A[1] <= B[1] & A[3]>=B[1]) | (A[3]>=B[3] & A[1] <= B[3])) &
  ((A[2] <= B[2] & A[4]>=B[2]) | (A[4]>=B[4] & A[2] <= B[4]))
}
I then use it to find all geometries that overlap with a bounding box around Ireland:
finds = sapply(coasts$geometry,
               FUN=function(x) {
                 bbolap(c(-11,51,-5.4,55.452), st_bbox(x))
               })
(A neater approach might be to use more than one bounding box: though the island is well-contained within this bounding box, it also catches a bit of Scotland, and some islands off South Wales.)
Drawing maps
We can then extract the rows describing Ireland, and plot them using ggplot2’s geom_sf() function:
ireland = coasts[finds,]
library(ggplot2)
ggplot(data=ireland) + geom_sf()