Simulating Single Transferable Votes in the UK
FPTP vs STV
The UK uses a first-past-the-post voting system (FPTP) that frequently leads to parties supported by significantly less that 50% of the voters forming majority governments. Many other countries use a variety of methods described as PR, proportional representation, which are intended to bring about electoral outcomes (parties’ share of seats) that are much closer to the parties’ share of support among voters. Ireland and a number of other countries use Single Transferable Voting in multi-seat constituencies, which works well and generally leads to more proportional outcomes. There is talk in the UK of moving to PR, but though it might yield better outcomes, it is unlikely to happen, because the two currently largest parties benefit from FPTP.
But how would PR change the outcome in the UK? In detail, this is difficult to say. First, and most importantly, voters would vote differently (once they understood the system: this may take a few electoral cycles). Secondly, the details matter: how constituencies were amalgamated, and other rules. In this note, I am going to make a rash attempt to give an estimate of the effect (and include an estimate of how much variation would depend on how constituencies are combined), if the UK were to move to multi-seat constituencies with preference voting (Single Transferable Vote, STV). There are two parts in this exercies:
- an algorithm that combines adjacent constituencies, with a random starting point but attempting to create coherent multi-seat constituencies, with a narrow range of sizes
- a prediction of the voting outcomes, based on a naive extrapolation of the historic FPTP vote
The first part is brute force: it considers very little except adjacency and minimising the perimeter of the resulting multi-seater. Each time it is run, it generates a different result, because once you start combining constituencies you begin putting constraints on what other amalgamations can be carried out. However, we can run it many times, not just to get an average result, but also to see how much variation there is from solution to solution.
The second part, extrapolating from the actual vote, is a limitation: as already stated, people will vote differently once they understand PR. PR makes it rational to vote according to your preferences, even if your favoured party has no chance. Under FPTP, people need to vote strategically, e.g., voting Lib Dem rather than Labour because the LDs have a better chance of beating the Tories, etc. The second problem is that the FPTP voting data tells us nothing about what the pattern of transfers between parties might look like. A further problem is that certain candidates are just not put to the electorate because the party cannot afford to fund hundreds of unelectable candidates: this affects the Greens for instance, who either don’t run or get negligible support in many seats; consequently they do much worse in this analysis than they would in reality. For the larger parties (including the large regional parties) we can have more confidence in the results, at least at the broad brush-stroke level.
Geography, geometry and sets
The most recent four elections (2010, 2015, 2017 and 2019) were conducted with the same set of constituency boundaries. We use digital versions of these boundaries to amalgmate single-seat constituencies into multi-seaters (https://www.data.gov.uk/dataset/76a9c59b-647f-46cc-8511-1cb6d52e5f1d/westminster-parliamentary-constituencies-dec-2021-uk-buc). Only adjacent constituencies are amalgamated, and the Scottish and Welsh borders break adjacency and are respected by the results. Island constituencies have to be made “adjacent” by hand (i.e., marked as adjacent to one or more mainland constituencies), but otherwise adjacency literally means a shared boundary. The target multi-seater size is 3-7 seats (which is achieved just short of 100% of the time), and an attempt is made to minimise the resulting perimeter (which is a computationally convenient way of favoring more compact multi-seaters).
The algorithm itself is relatively simple: it picks a constituency at random, and amalgamates it with a random neighbour with which it a perimeter. It then keeps picking single or multiple seat constituencies (as long as they are not bigger than the maximum) and attempting to do the same, until all constituencies are in appropriately sized multi-seaters or have no free neighbours. This is imperfect, as constituencies may be left behind, because all their neighbours amalgamate with others, and also some of the resulting multi-seaters can have non-compact shapes. A second pass takes multi-seat constituencies at random, and checks whether swapping a single-seater with a neighbour results in better sizes and shapes. This is done in Python, and is slow (though Python’s flexibility makes it reasonably easy to program). It usually results in an acceptable distribution of constituency sizes (nearly always falling between the desired maximum and minimum sizes), which are reasonably compact.
Note that the task of amalgmating constituencies is not easy, and it is certainly not easy to optimise. If it were to be done in the real world, lots of contextual decisions would be made (such as, for example, amalgamating urban areas together to create a single city multi-seater alongside a rural one, rather than two mixed rural/urban multi-seaters; or politically-loaded ones based on the consequences for results). However, the order of amalgamation matters, as earlier choices preclude certain later ones, meaning not every desired outcome can be achieved for every constituency. Whatever the criteria, there is no single “best” solution. Thus, simulating a large number of partially-optimised solutions allows us to get a sense of how much variability in the outcomes there is across different patterns of amalgamation.
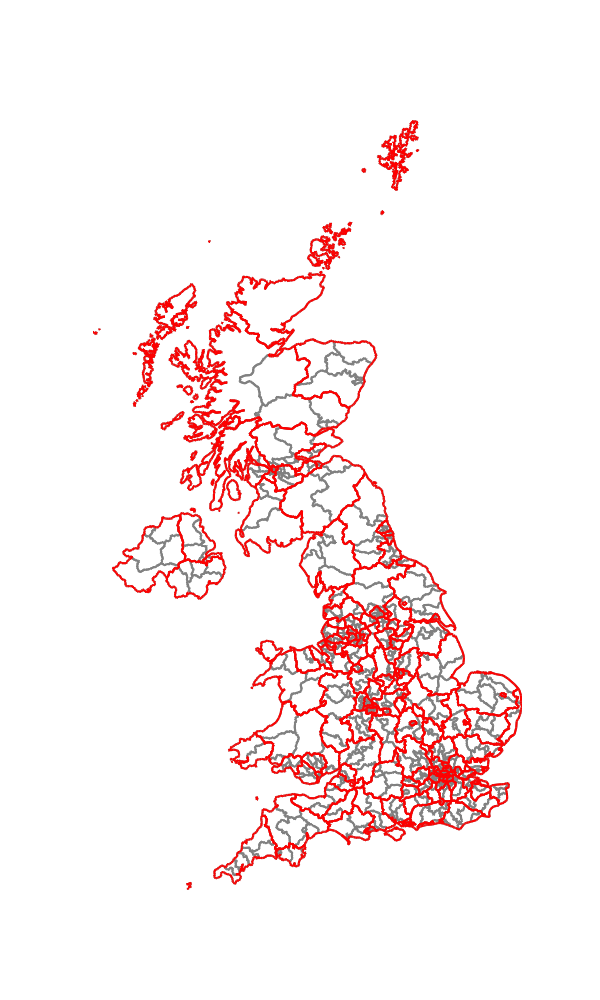
Here’s an example solution, mapped, with multi-seater boundaries in red, single in grey:

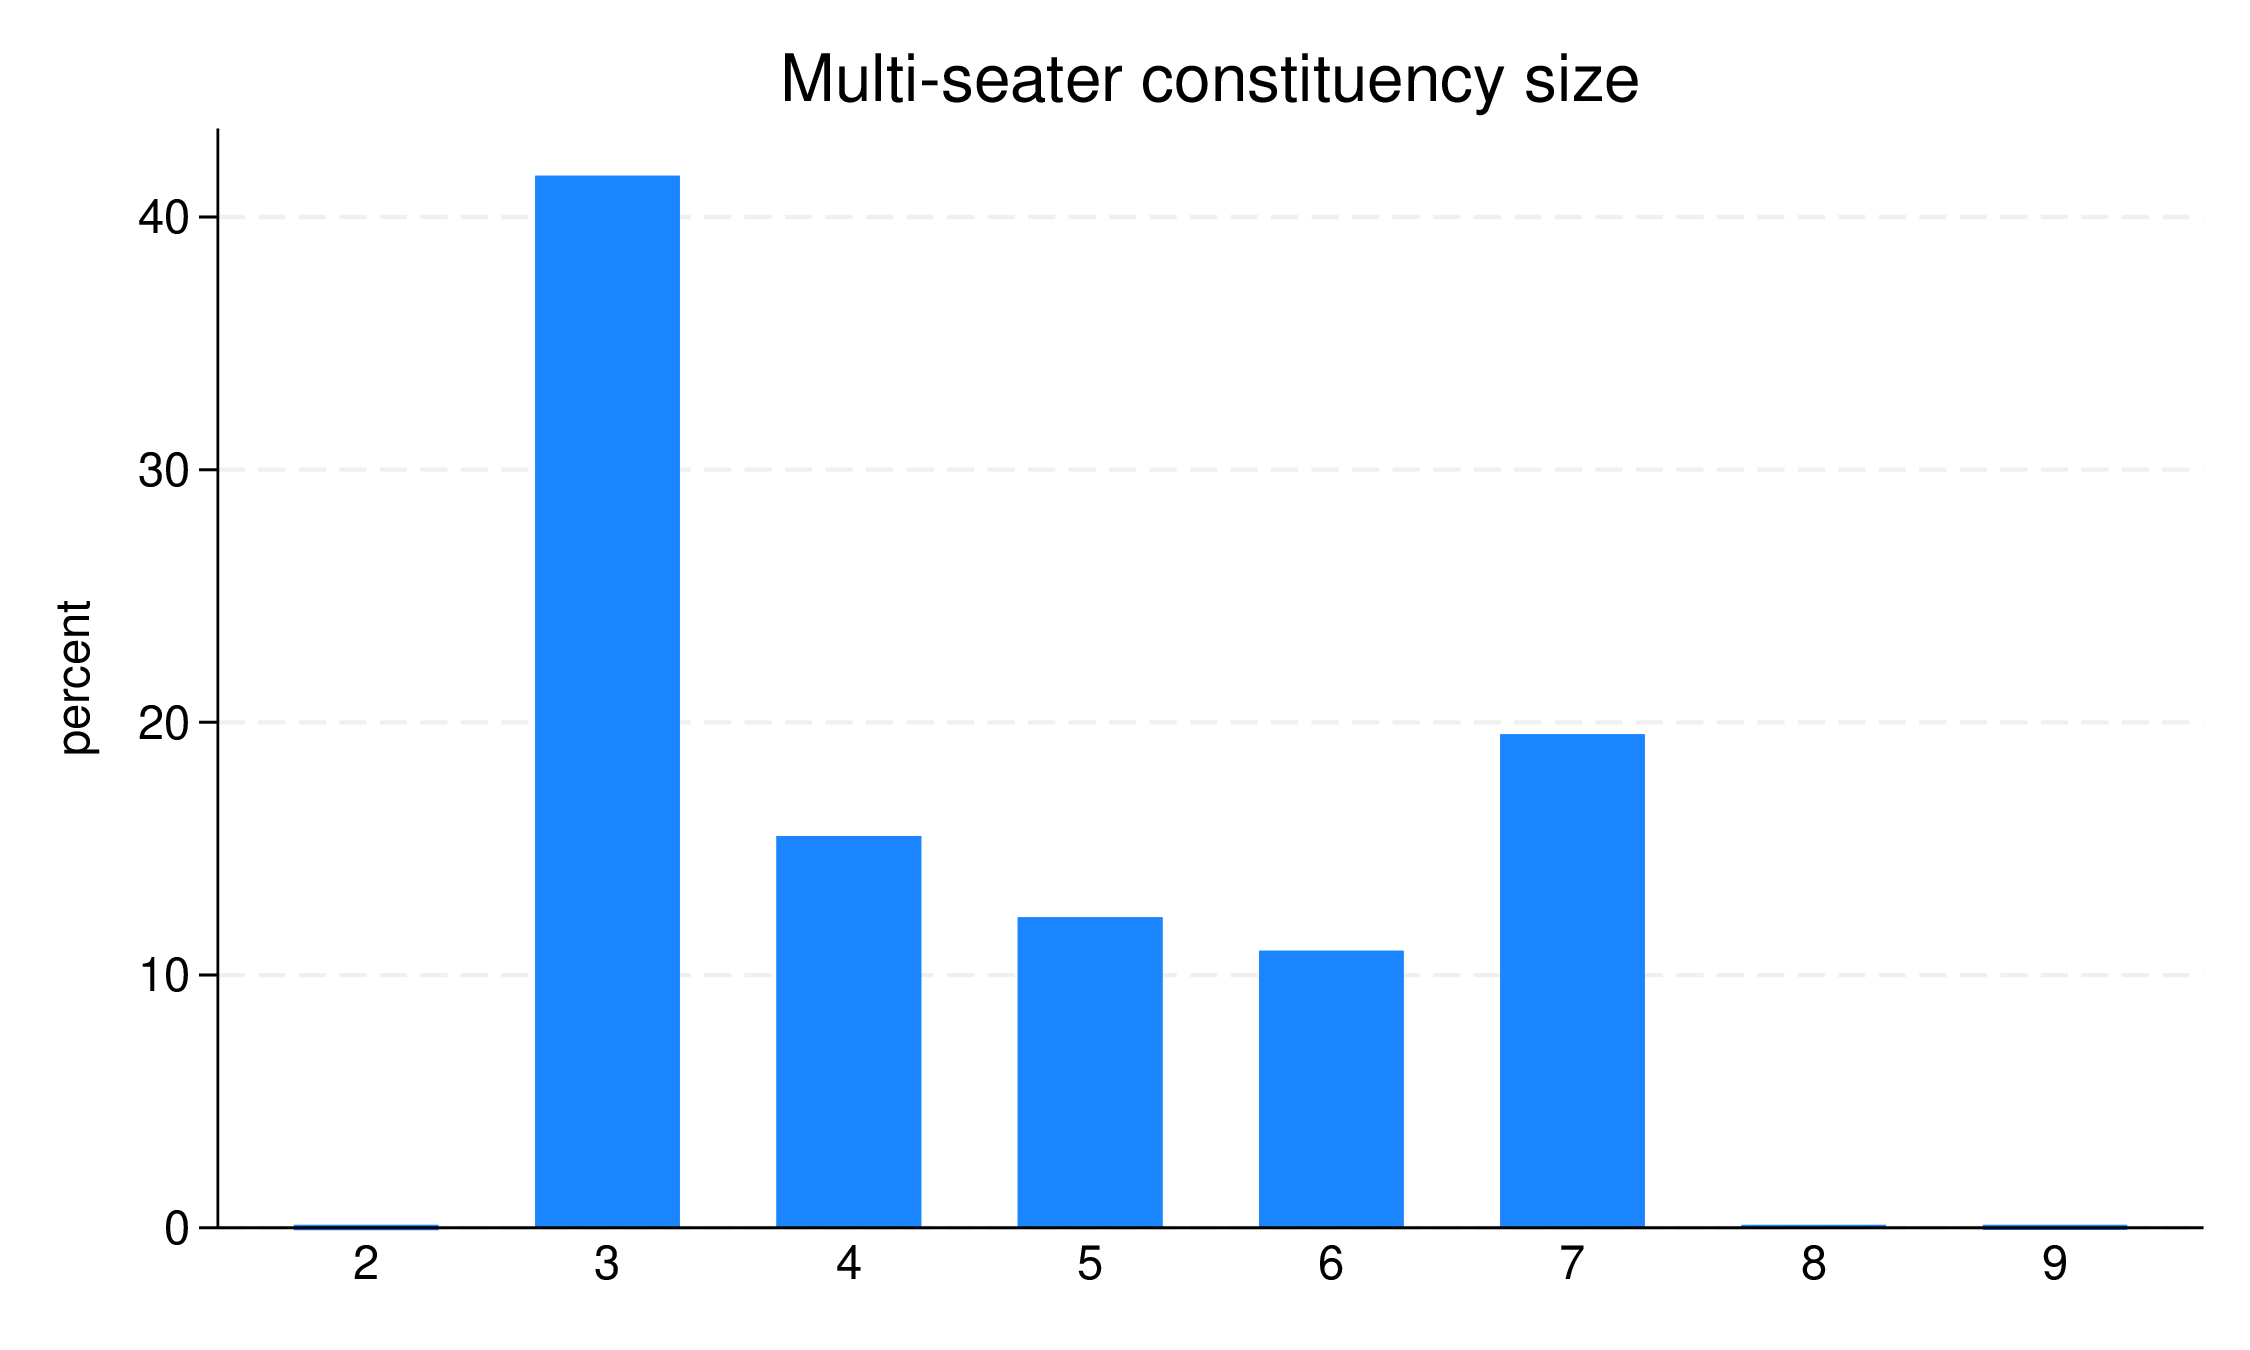
In the analysis which I am reporting here, the desired multi-seater size is set between 3 and 7. 1000 solutions are generated. A negligible number of times, multi-seaters outside this size range are created. However, 3-seaters are disproportionately generated, accounting for about 40% of the results.

Arithmetic
Once we have a mapping from existing into multi-seater constituencies, we can try to assess the consequences. We can extrapolate from the actual vote in an election to what the multi-seater vote might be. We are on unstable ground here, though, since
- FTPT votes are subject to strategic voting and don’t disclose preferences reliably
- Even if it were reasonable to use FTPT vote to predict first preference, we have no information on subsequent preferences and hence on transfers
- Given the reality of FTPT, small parties get tiny votes and don’t put up candidates everywhere
With those caveats highlighted, we go ahead since we have no other data to work with. The strategy is to pool the real single-seater votes, party-wise, and to assume very strong party discipline: if you voted for party X in reality, you’d give first preference to a party X candidate in a multi-seater, and give your subsequent preferences to other party X candidates before any others. Using this strategy, we calculate the number of quotas1 represented by each party’s cumulative vote, and count that number of candidates elected. We then share the remainder on a purely proportional basis (using the heroically wrong assumption that there is no pattern to transfers). This is a fairly crude simulacrum of how STV counts actually work, though hampered by the absence of data on the real preference ordering.
Four elections
Given that four elections (2010, 2015, 2017 and 2019) were fought on the same boundaries, we can run this analysis four times. Happily, the actual outcomes vary quite a bit across the four elections, so we see the performance of the simulated STV constituency structures in different contexts. The other thing to bear in mind is that we have 1000 different STV constituency structures, so we get a distribution of outcomes. Perhaps the easiest way to get an overview is to consider the predicted number of Conservative seats across the four elections, where in reality they respectively fell short of a majority but could go into coalition (2010), managed a small majority (2015), lost it and operated as a minority government (2017), and finally won a stonking majority (2019). Histograms of the results for the four elections are show in the next graphic.

The headline result is that the average STV number of seats is way, way below what was actually achieved:
- 2010: about 250 vs 306 in reality
- 2015: about 275 vs 330
- 2017: about 295 vs 317
- 2019: about 320 vs 365 achieved.
Only in the 2019 election, with its very healthy real-life majority, do any of the simulated results give a majority: about 12% of them.
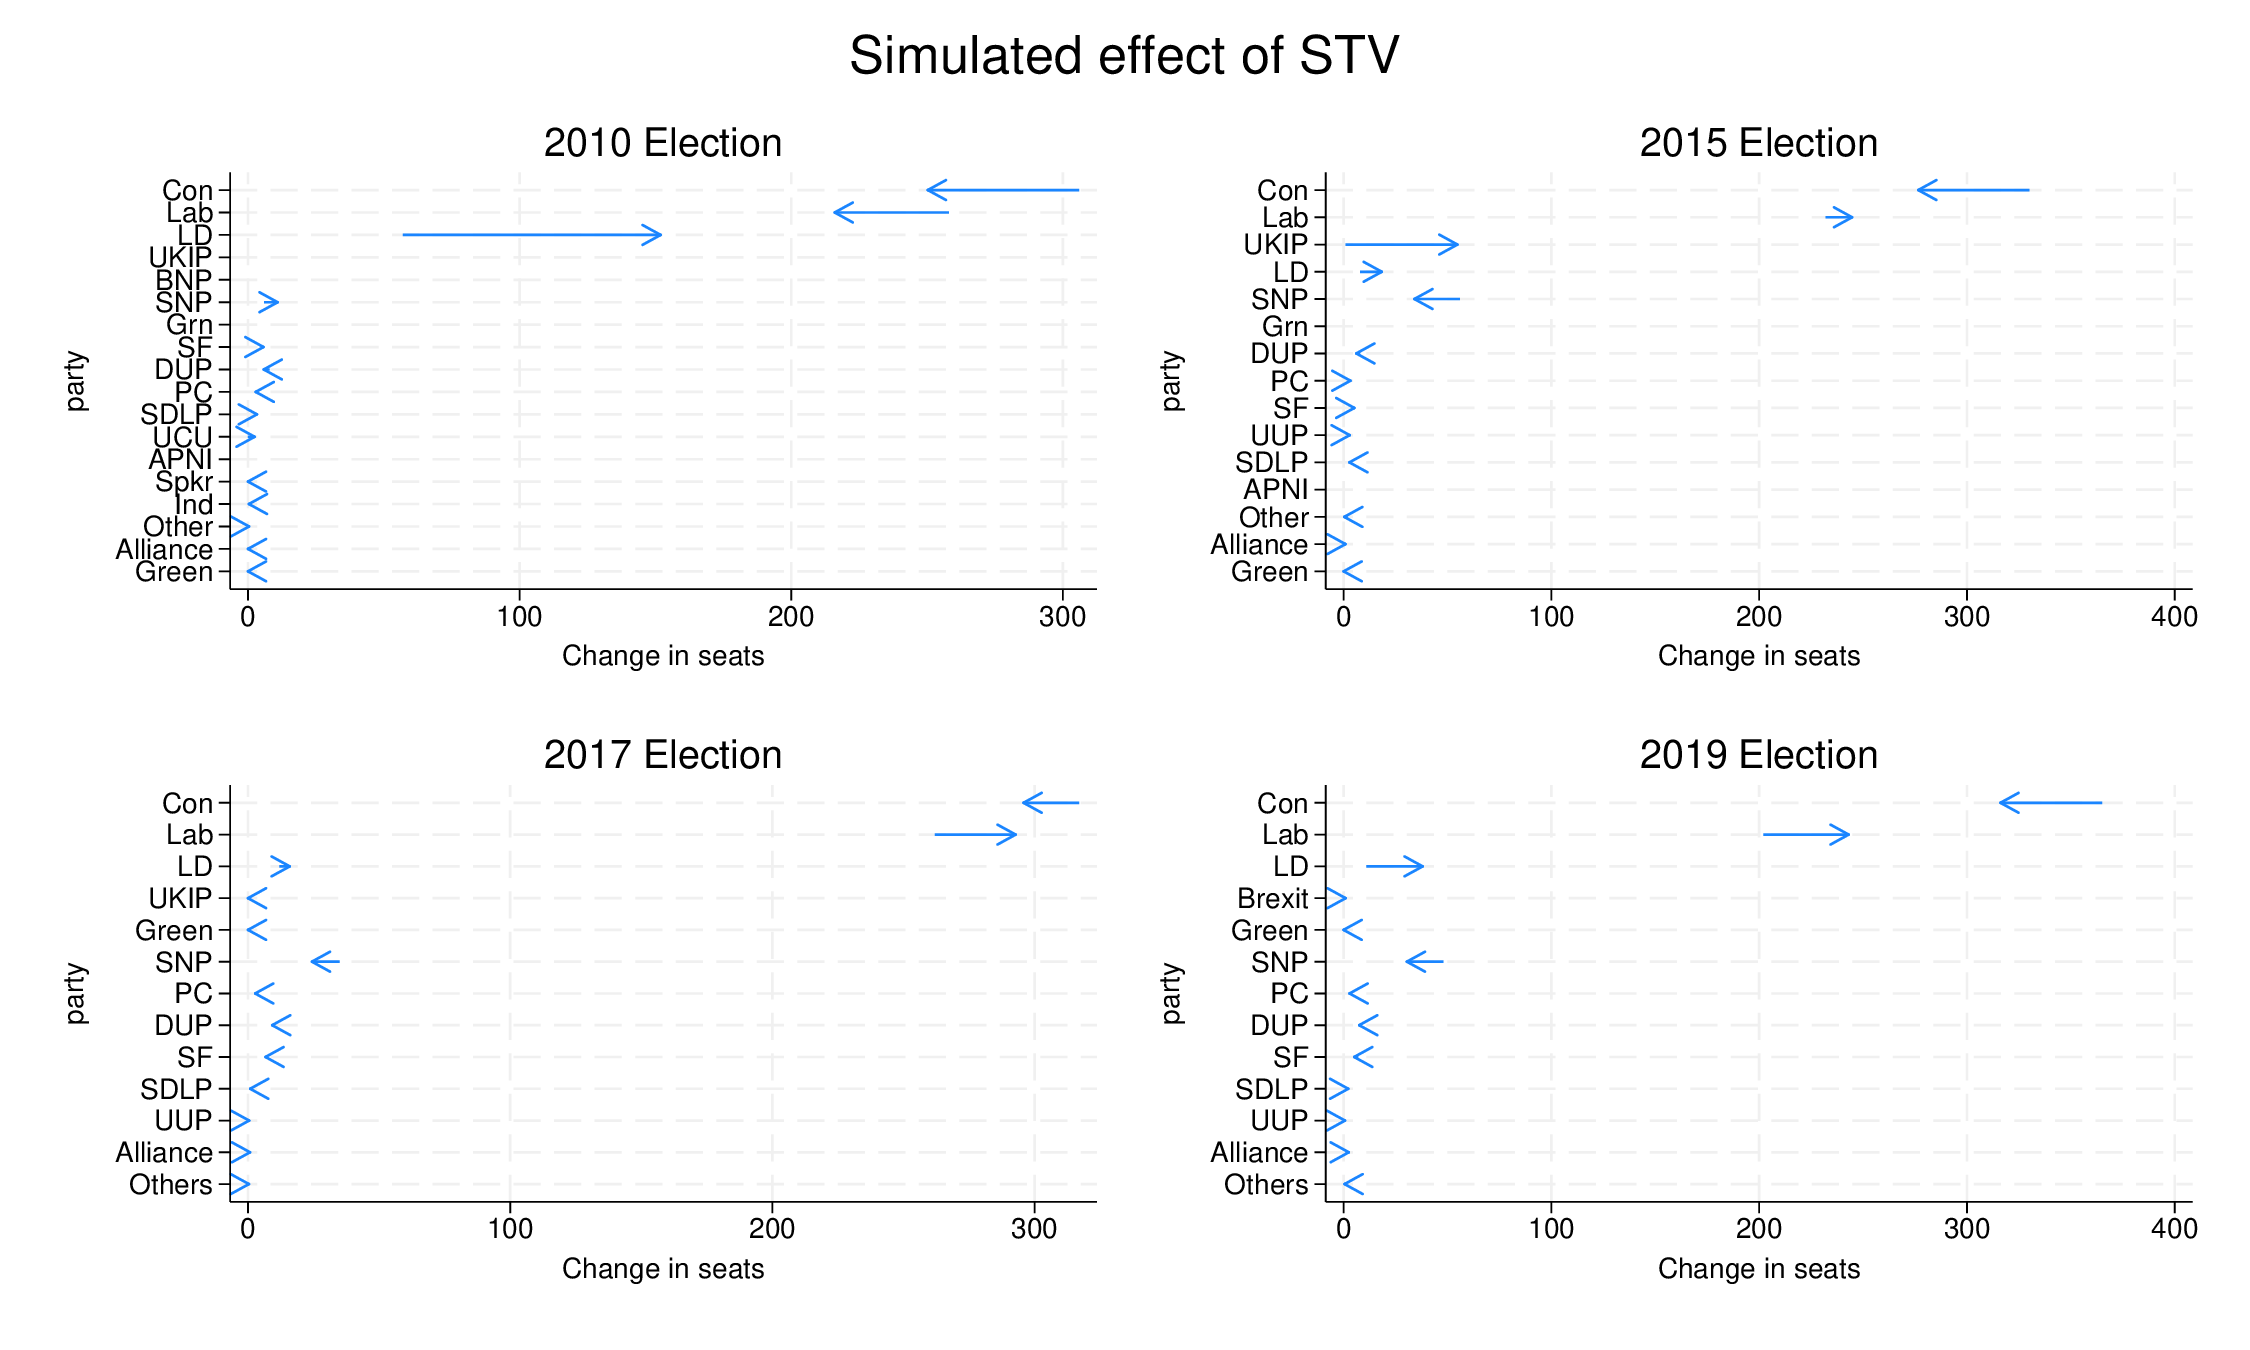
If we dump the results for all parties over the four elections, we get the following picture with arrows from the true result to the average simulated one:

It is really a two-party system in most circumstances, though the Liberal Democrats made an impact in 2010 (in reality and simulation). In the “regions”, Scottish, Welsh and Northern Irish parties do reasonably well because while they may be very small parties nationally, they have sufficient local support to gain seats even under FPTP, and in the later three elections the SNP have had very strong support. UKIP also features briefly. However, overall it is a two-party system with bit-parts for the LDs and the SNP.
In all elections the Tories get more seats than the mean simulation gives them. For Labour, it varies: FPTP overstates their support in 2010 and understates in in 2017 and 2019. The LDs showed very well in 2010 but would have done much better under STV. On the smaller Scottish stage, the SNP benefitted from FPTP in the later three elections (where they did well).
Do different amalgamations have systematic biases?
In each election, the range of results varies quite widely. In 2019, for instance, where the Tories won 365 seats, the median simulation gave them 316, with the 90% band running from 304 to 327. Clearly, from one configuration to another there are substantial differences in the outcome. Are these differences systematic? That is, do certain configurations tend to favour a given party across elections? If that is the case, any process to establish STV will risk to be under significant partisan strain when it comes to new constituency boundaries (well, even more than usual). We can get a quick overview by correlating predicted Conservative seats across elections:
{{<table “table table-striped table-bordered”>}}
| 2010 | 2015 | 2017 | 2019 | |
|---|---|---|---|---|
| 2010 | 1.0000 | |||
| 2015 | 0.1286 | 1.0000 | ||
| (0.0000) | ||||
| 2017 | 0.0045 | -0.0088 | 1.0000 | |
| (0.8857) | (0.7812) | |||
| 2019 | 0.0118 | 0.0884 | 0.0939 | 1.0000 |
| (0.7084) | (0.0051) | (0.0029) |
{{</table>}}
(p-values in parentheses)
There is a small positive correlation between 2010 and 2015, and even smaller between 2015 and 2019, and 2017 and 2019. There seems to be a break between 2010/2015 and 2017/2019. That is, the correlations are low or null, and it seems any systematic effect is subordinate to actual changes in electoral support. I’m not sure if this should be surprising.
Summary
STV would change the electoral landscape in the UK, not least by making it much harder for the Tories to form governments (or Labour, for that matter). It would also be good for smaller parties, if not for those (like the SNP) with strong geographically bounded support.
The effect carries uncertainty, as different configurations of multi-seaters yield different results, but in all cases with significant alteration of the result.
The weakest part of this exercise is the reliance on FPTP voting data, when the process needs the pattern of preferences. If we really had information on preferences, we would undoubtedly see more support for parties that currently do very poorly (or do not run candidates). In that much, the projections here can be considered to be conservative, yielding results that stay closer to the status quo than to what would really emerge if STV were implemented. However, my suspicion is that we will never know because the UK (as currently constituted) will never switch to PR.
-
A quota is 1 plus the valid vote divided by 1 plus the number of seats: in a one seater it would be 50% + 1, in a three seater 25%+1, etc. ↩︎